The Segment Analyzer Insight displays the filling level for profile properties of a specific segment of customer or visitors. The information is shown in a circular graph.
The Segment Analyzer insight and its controls
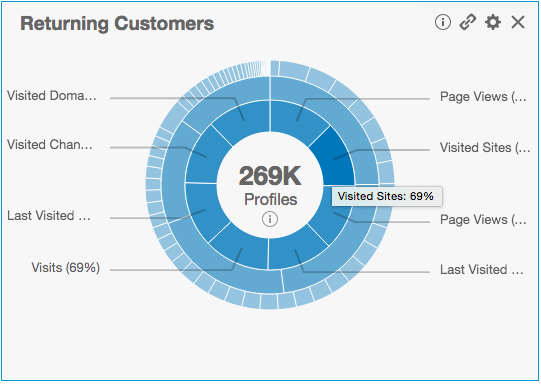
Below is an example of a Segment Analyzer graph:

In the center of the graph is the number of profiles within the current selection. Around the center are rings divided into customer segments. Each segment represents a profile property. Hover over a particular segment to see the name of the profile properties in that ring and which percentage of the profiles have a value for the property, the "fill rate".
The chart is constructed as follows:
- Determine the number of profiles based on the current selection. If nothing has been selected, use all profiles.
- Determine all profile properties and their fill rate.
- Disregard all profile properties with a fill rate of 0%.
- Sort the profile properties based on their fill rate and place them in a ring accordingly. The inner ring holds the properties with the highest fill rates, the outer ring the properties with the lowest fill rate.
- The number of rings is configurable – profile property fill rates differ depending on the number of rings selected:
Number of rings Ring 1 (inner) Ring 2 Ring 3 Ring 4 4 100% - 75% 75% - 50% 50% - 25% 25% - 0% 3 100% - 67% 67% - 33% 33% - 0% 2 100% - 50% 50% - 0% Rings may turn out to be empty if there are no profile properties with a matching fill rate. The chart in the example has 3 rings. Hovering above ring 2 highlights eight profile properties that have a fill rate between 67% - 33%.
- Each ring contains the profile properties with a matching fill rate as explained above. The chart in the example shows that the highlighted profile property "Visited Sites" has a fill rate of 69%.
- Labels can be selected in the configuration, in which case the ring segment of a profile property will be colored by its label. If the profile property has no label, it will be colored blue. The example shows a chart without any labels configured, so all profile properties are colored in shades of blue, where inner rings are a darker shade than the outer rings.
How to create a Segment Analyzer Insight in BlueConic
- Open (or create) a BlueConic Dashboard.
- Click Add Insight and search for 'Segment Analyzer' in the list of available insight types.
- Select the Segment Analyzer Insight plugin. It's created and placed on the current Dashboard.
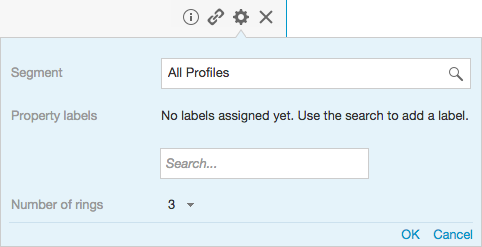
When the insight appears, click Configure this Insight to choose the segment and settings to display.
Configure the Segment Analyzer insight in BlueConic

- Segment (required)
- Select the segment that you want to inspect.
- Property labels (optional)
- Select labels to colorize profile properties by the label that they have assigned to them. Properties not matching any label will be colored blue. If no labels are selected, everything will be colored blue.
- Number of rings
- Select the number of rings you want to display in the graph.
Learn more about BlueConic customer segments
To learn more about customer segmentation, see Creating dynamic customer segments in BlueConic.