
Place the Visitor Activity insight on a BlueConic dashboard to see in real time the current number of customers, visitors, and events taking place in your domains. The visitors are represented by the dark blue line and the events are represented by the light green bars. On the left Y axis, the scale for the number of customers and visitors is shown. On the right Y axis, the scale for the number of events is shown. At the bottom right part of the X axis, the present moment is shown and the event and visitor numbers for the last number of seconds flow from right to left. The activity is refreshed once per second. For example: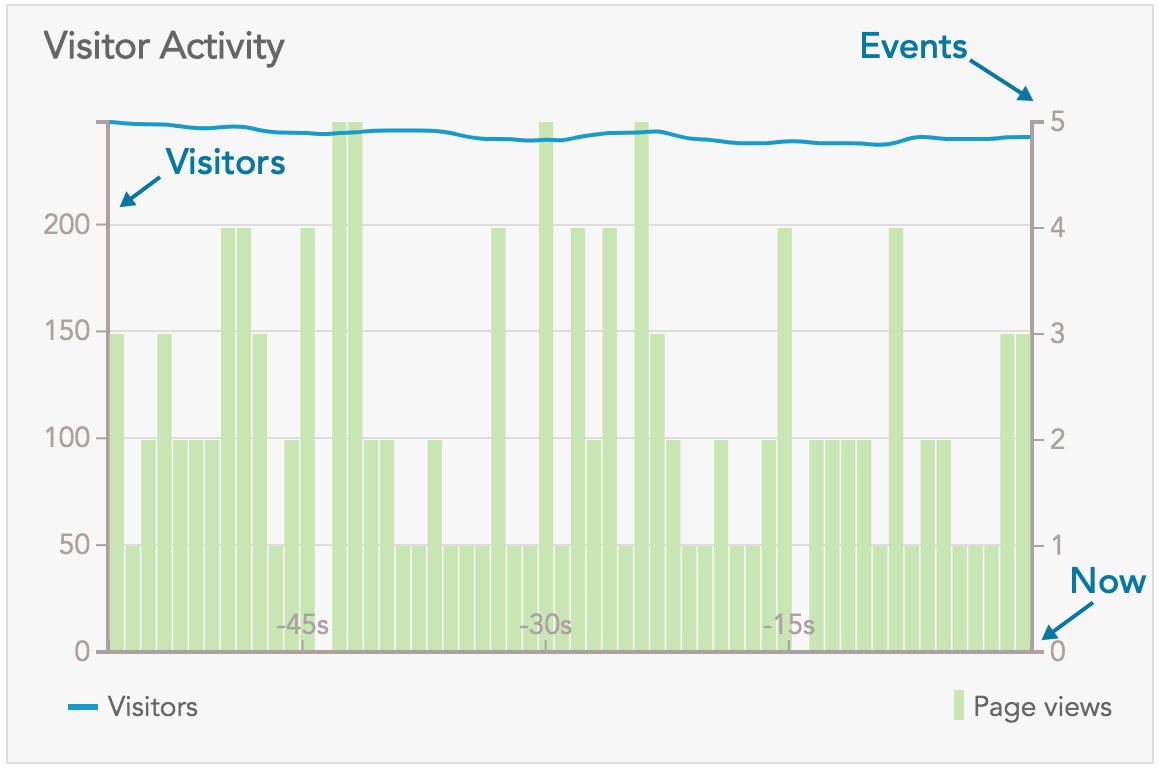
The scales for the Y axes are variable and depend on the total numbers that are being counted for the events and visitors.
Learn more about measuring your results with BlueConic insights and dashboards.